Download(windows executable with installer), updated 27/8/2010
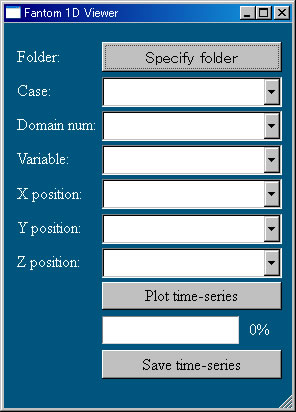
This software plots the time-series of the variables at one location in 3D domain. Procedure is as follows:
1. select a folder where output files exist
2. select a computational case (case name)
3. select a domain (domain number)
4. select a variable to show
5. select x, y and z positions
6. push plot button to show a graph
7. push save button if want to save the plotted data to ASCII type file
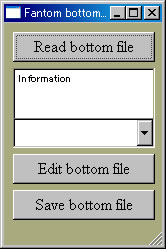
Download(windows executable with installer), updated 01/9/2010
(Warning and limitations)
- Data of each domain must be separated by a blank line in bottom file (ASCII file)
- Land area have to be expressed by zero, "0", nolimitations for unit and sign
- A domain exceeds 100x100 cannot be edited (may be stack overflow due to too many buttons)